Listicle
•
Dec 23, 2025
Anthology: Fintech Metrics in stories
“When you know all the names of that bird in every language, you know nothing, but absolutely nothing, about the bird.” - Richard Feynman
It’s easy to know a metric: learn the definition, pull the data, do the math Understanding a metric is different. It’s being able to look at a business in all its context and complexity and say, these are the numbers that matter right now - the ones that tell you whether things are actually going well, and the ones that can quietly decide where the business ends up.
That kind of understanding doesn’t come from memorizing formulas. It comes from seeing metrics do real work in real situations: the moment a growing revenue line masks worsening economics, when volumes are surging but the business keeps progressively less of it, or when a growth story feels inevitable until you translate it to time & cash required.
So, here’s a list of key Fintech metrics along with a modicum on understanding through real stories that unfolded with a particular metric at their center.
Total Payment Volume
Definition:
Total Payment Volume (TPV) measures the total monetary value of all transactions processed through a company’s payment platform during a specific period. It shows scale and traction - a rising TPV means more transactions and adoption.
Fact:
It was a cold afternoon in November 2024, the Black Friday-Cyber Monday weekend had arrived. People everywhere were glued to their phones, fingers hovering over checkout buttons, racing to catch flash sales before they vanished.
But for Stripe, it meant something very different.
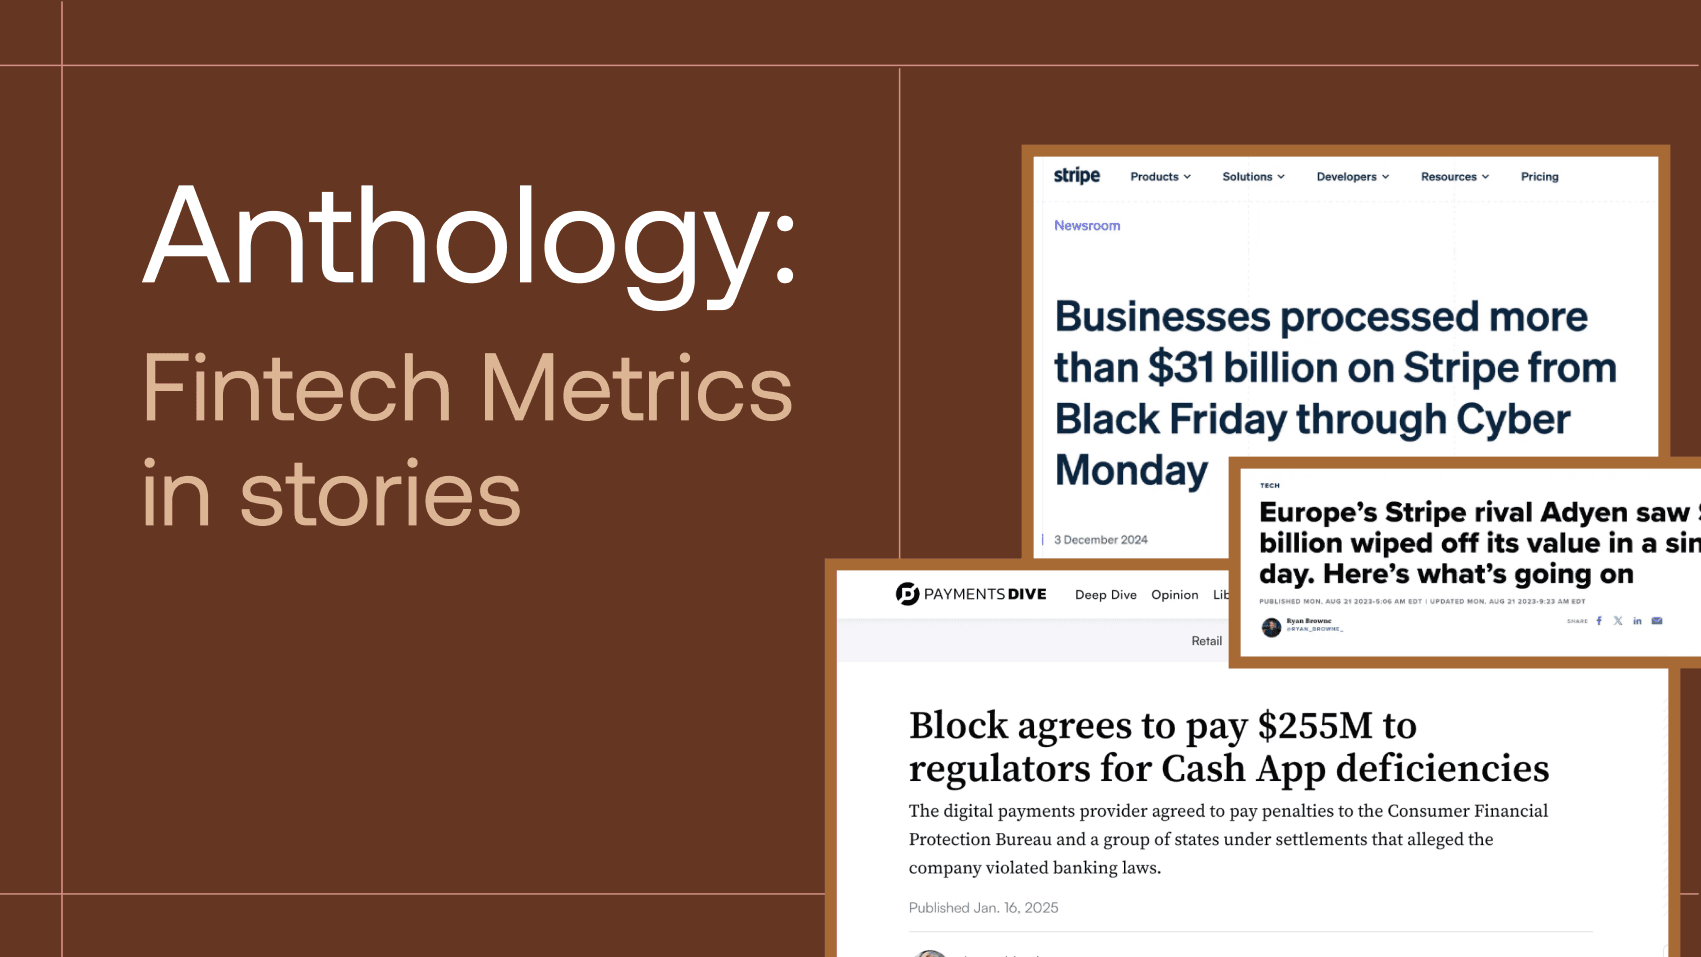
By the end of this weekend, Stripe would have processed 465 million transactions and more than $31 billion in total payment volume. This would be the biggest spike in its history.
For payment processors, Black Friday, Cyber Monday, Singles Day - these events drive 5-10x higher transaction volume than normal.
These are the events where they make huge profits, but also where they break. If the system fails during a surge, it's catastrophic. It leads to lost revenue, lost merchants, and lost trust.
To survive these spikes, Stripe runs chaos testing. They deliberately break their own systems to uncover problems before production, preparing their infrastructure for exactly these moments. They've shared these practices in their public engineering talks.
That weekend, Stripe's systems held. The preparation worked.
Take Rate %
Definition:
Take Rate is the percentage of a transaction's value that a platform keeps as a fee for processing the payment. It shows pricing power. Two companies with identical TPV can have vastly different revenue based on take rate alone
Fact:
August 17th, 2023. Adyen's stock crashed 39%, wiping out $20 billion in market cap, one of the largest single-day value drops in fintech history.
That same morning, the company released its earnings report for the first six months of the year. Revenue growth came in at 21%—half the 40% analysts expected.
Adyen revealed the reason in their H1 2023 shareholder letter: "Enterprise businesses prioritized cost optimization, while competition for digital volumes in the region provided savings over functionality.”
In plain words, Adyen had refused to cut take rates while competitors slashed prices. But the market didn't care about their strategy. Enterprise accounts had started walking out. One by one, to Stripe, to Square, to anyone cheaper.
Adyen had gambled that their enterprise customers would stay loyal. They believed their value justified premium pricing. They were wrong. By the time the stock collapsed, customers had already made their choice—they'd voted with their wallets for cheaper alternatives.
The market had spoken. When customers abandon you to save on fees, your premium pricing was never premium at all.
Cash Burn
Definition:
Net burn is the actual cash a company loses each month—what you spent minus what you collected. It tells you how many months you can survive before the bank account hits zero.
Fact:
On January 23, 2024, Brex laid off 282 people—20% of its workforce.
The timing didn't make sense. In Q4 2023, Brex had just posted 32% year-over-year revenue growth. The company's gross profit was up 75%. The top-line metrics signalled that Brex was winning.
But there was a problem hiding in the cash burn.
In Q4 2023, Brex burned $17 million every month. That's $200 million a year - A pace that seemed unsustainable.
The eventual reset was called "Brex 3.0" by the founders — they flattened management, cut organizational layers, and created direct lines to leadership.
For investors, it meant that a company can report 32% revenue growth and still be burning unsustainable cash. The top-line metrics don't tell the whole story. Leadership had finally looked at the burn number and made the hard call to align spending with reality.
Monthly Active Users
Definition:
Monthly Active Users (MAUs) count the total unique users performing a qualifying activity on the platform within a calendar month, signaling engagement and network scale in fintechs.
Generally, an "active" user in fintech performs an action that shows meaningful engagement with the core product value proposition.
More active users means more transactions and fees coming soon. MAU growth shows you where revenue is headed before it hits the financial statements.
Fact:
Block's CEO Jack Dorsey loved to talk about Cash App's presence in hip-hop culture. It was proof of mainstream appeal.
In one song, Teejayx6 rapped:
"They banned my Cash App because I sent a thousand transactions. I just bought another phone and made a Cash App."
The song called out how easy Cash App made it to run scams. Who knew Teejayx6 might have been too right about this.
In March 2023, the activist short-seller, Hindenburg Research released a report based on two years of investigation. They alleged that 40-75% of sampled Cash App accounts were fraudulent or duplicates. Block's "frictionless" signup— using just an email or phone number—let scammers create endless accounts, bloating MAU numbers.
The stock plunged by more than 15% the day this came out.
By 2025, shareholders sued and regulators fined Block over $255 million for fraud handling and compliance failures.
Jack Dorsey's $1 billion in insider stock sales during the pandemic boom suddenly looked like an exit before the truth emerged.
Revenue Multiple
Definition:
EV/Revenue measures how much investors are willing to pay for each dollar of a company's annual revenue. If a company generates $100M in revenue and has an enterprise value of $500M, its EV/Revenue is 5x—investors value the business at 5 times its annual sales. Revenue multiples let you compare valuations and spot overpricing. Higher multiples mean investors expect faster growth or better margins.
Enterprise Value is what it would cost to buy the entire company—its market cap, plus debt, minus cash.
Fact:
SHORTER VERSION
Within hours of Klarna's IPO in September 2025, its valuation jumped from $14 billion to $19.7 billion. The revenue multiple went from 5x to 7x—a 40% premium over the IPO price.
Klarna had priced themselves cautiously at 5x, well below the 8.8x average other fintechs commanded. The IPO filing showed a $152 million loss in H1 2025. Revenue had grown 20-24%, but couldn't cover the red ink.
The caution made sense. In 2021, Klarna hit $45.6 billion in valuation, riding the Buy Now Pay Later wave. Then interest rate hikes and regulatory scrutiny crashed its valuation 85% to $6.7 billion.
Now they were coming back, trying to rebuild.
When the stock hit NYSE, the market had other ideas anyway. Valuation shot to $19.7 billion—7x revenue. By close, it settled at 6.2x.
And revenue multiples, as it turned out, weren't just numbers. They were bets on whether Klarna could turn losses into profits and whether their growth would outrun the bleeding.
The market bet cautiously optimistic at 6.2x. The IPO priced for maximum caution at 5x.
The gap was real, but not a chasm. Just enough room for hope, and just enough doubt to keep everyone honest.
CAC — Customer Acquisition Cost
Definition:
Customer Acquisition Cost (CAC) measures the average cost a fintech spends to acquire a new customer, encompassing marketing and sales expenses. It's a crucial metric that signals the efficiency of growth efforts.
Fact:
SHORT VERSION
Customer acquisition cost obsesses investors. Spend too much acquiring users, and your unit economics break. Get it right, and you've got a money-printing machine.
In November 2021, when Brazilian neobank Nubank filed for IPO, buried in the S-1 was a number that made every investor stop: a customer acquisition cost of $5 per customer. Not $500. Not $100. Five dollars.
Of that $5, only $1 came from paid marketing. The other $4? Organic. Word of mouth. Eighty percent of their customer base arrived without a dollar spent on ads.
Meanwhile, U.S. fintechs were burning $250 to $1,500 per customer. SoFi was at $40. Nubank was acquiring customers 50 to 300 times cheaper.
But cheap acquisition only matters if customers spend money. Nubank's economics proved it worked. Customers generated $23-$34 per month—payback in barely a month. In nine months of 2021, Nubank spent $45 million on marketing, added 20 million customers, and generated $1 billion in revenue. Over a customer's lifetime, they made 30 times what they spent acquiring them. Most companies celebrate 3x. Nubank hit 30x.
They IPO'd at $50 billion in December 2021. Warren Buffett's Berkshire, which had invested $500 million earlier, scored a massive win.
That $5 CAC proved the model was self-sustaining. Customers brought other customers. Revenue followed.
Gross Margin
Definition:
Gross margin is what's left after you subtract the direct cost of delivering your product. If you charge a customer $100 and it costs you $30 in payment processing and card issuing fees, your gross margin is 70%. If it costs you $110 to deliver a $100 product, you're losing money on every sale—and selling more just loses money faster.
Fact:
SHORT VERSION
January 2021. London. The term sheet sat on the conference table like a trophy. £95 million. Series C. Curve's founder smiled for the investor announcement photos.
But in a dusty corner of Companies House—the UK's public registry where every private company must file accounts—something was missing. Curve's 2019 financials were late. Very late.
When they finally surfaced months after the fundraise, an analyst at a competing fintech nearly choked on her coffee.
Revenue: £5.9M. Doubled year-over-year. Impressive.
Gross margin: -36%. Whaaat??
They were losing money on every transaction. Curve's cost to deliver its product was 36% higher than revenue. Growth made losses worse, not better. Total losses quadrupled to £28.5M.
£95M raised just to keep the lights on. Did the investors know before they wired the money?
But 18 months later, something changed. Q4 2022, gross margin turned positive. By end of 2023, pre-tax losses cut nearly in half—from £69.1M to £36M.
Curve rebuilt entirely—adding subscription tiers, premium features, platform fees on top of low-margin card interchange. Negative gross margins require fixing unit economics: cut delivery costs or add higher-margin revenue. Curve did both.
It took three years and that £95M war chest. Most companies don't make it.